Determining Your Alarm Levels Using A Severity Chart
January 5, 2021Once you have a measurement of your vibration and level – it might be helpful for you to consider a severity chart.
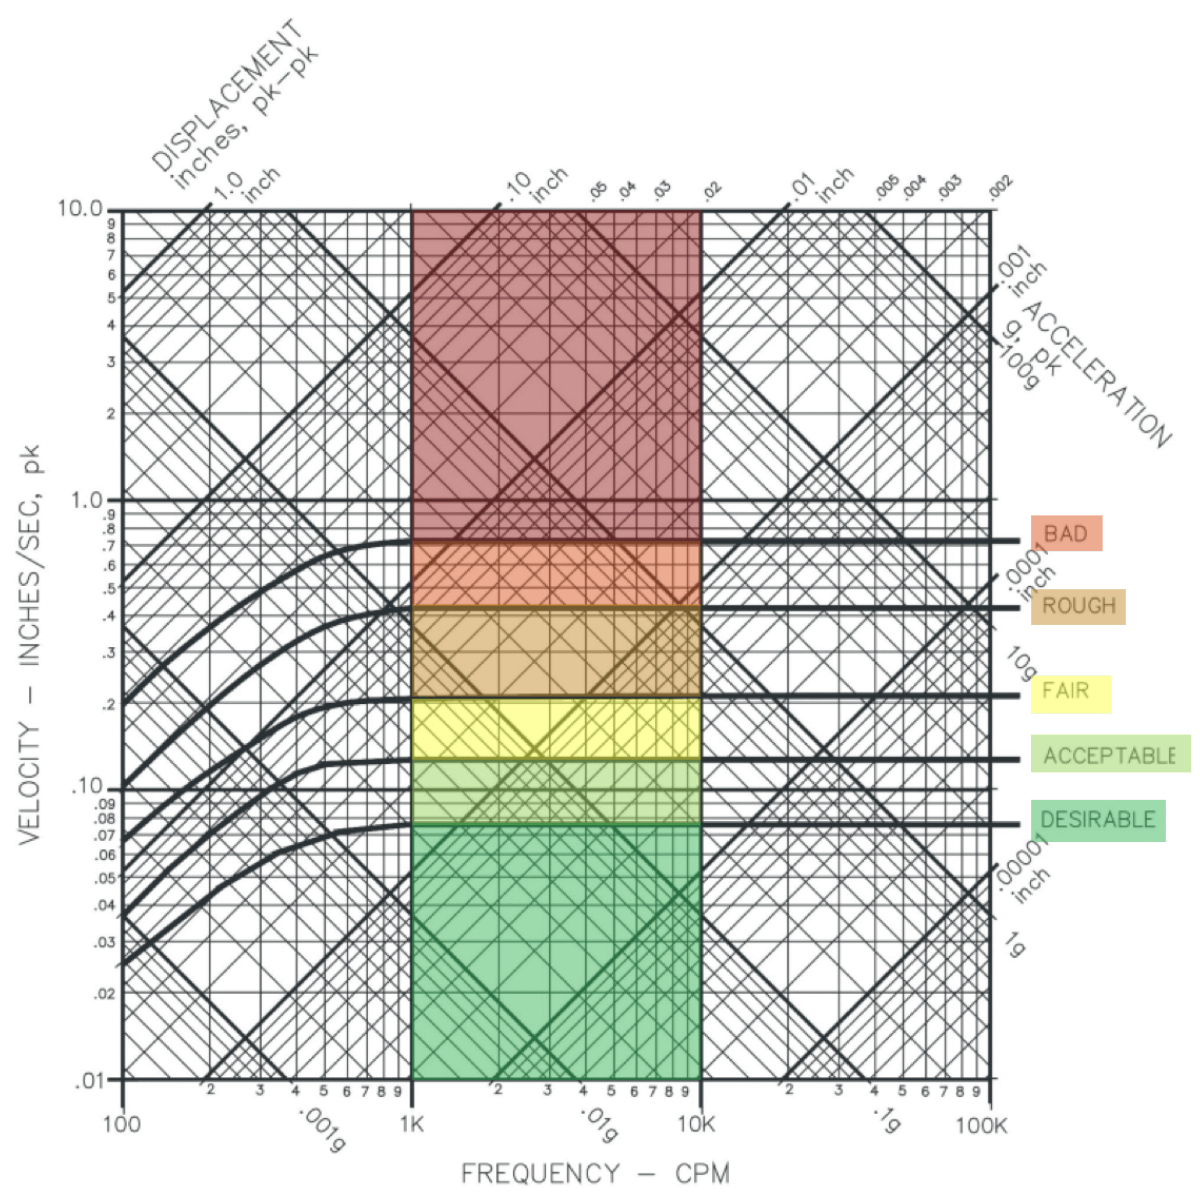
These charts are used for determining how severe your vibration is and may help you determine your alarm levels at your facility based on standards that are generally accepted across your industry.
This chart shows frequency on the x-axis and increases from 100 cycles per minute up to 100,000 cycles per minute.
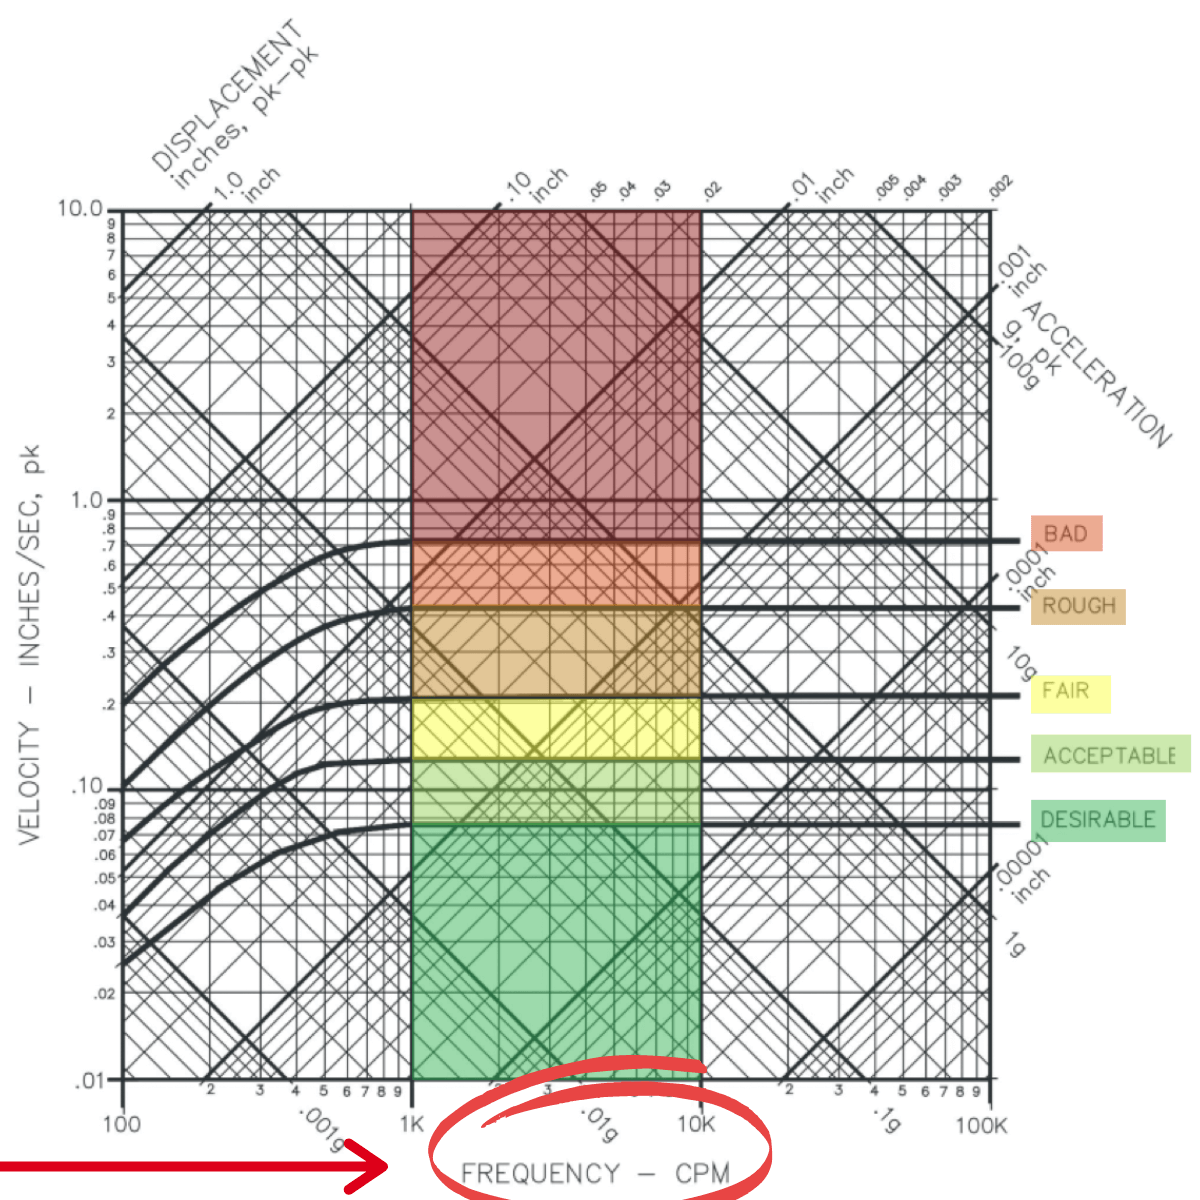
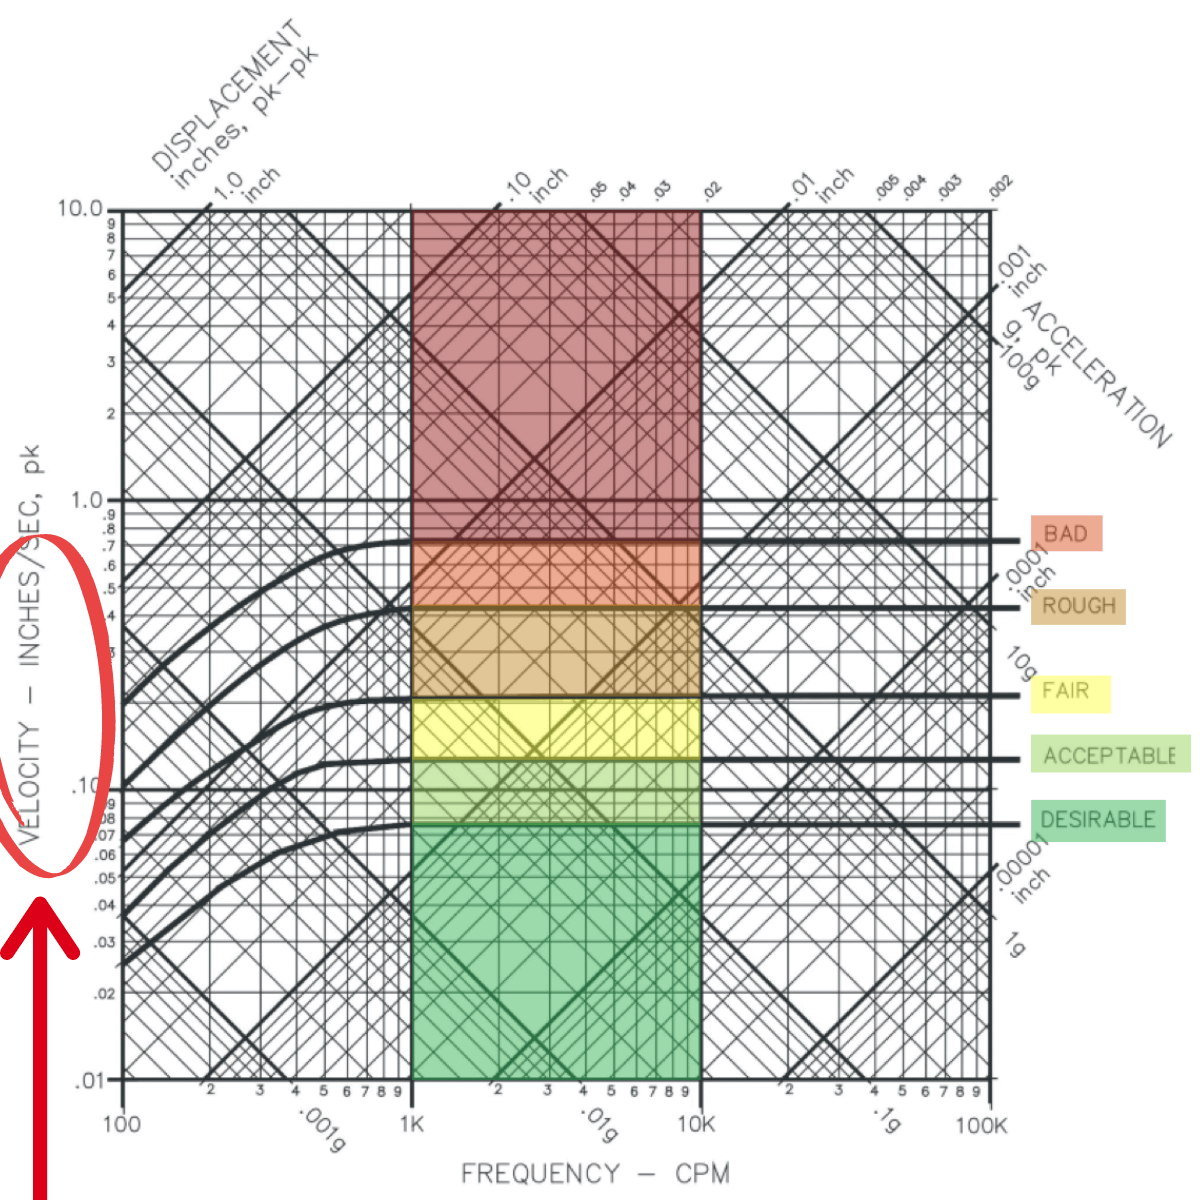
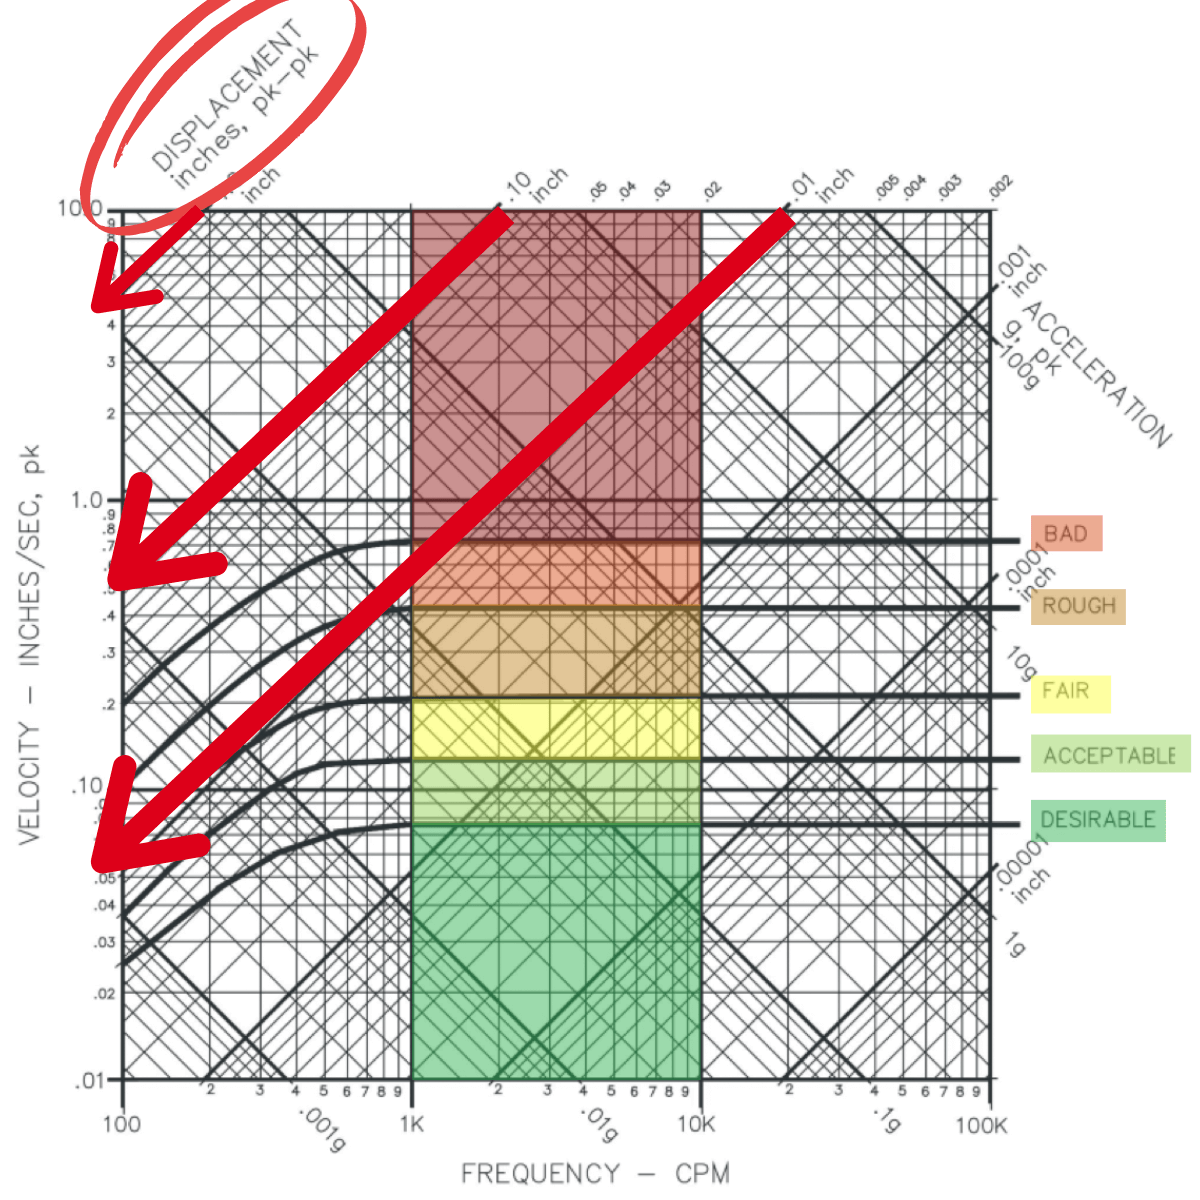
These charts are logarithmically scaled.
The diagonal axis shows acceleration and goes from .001g up to .1g.

The vertical axis shows constant velocity and ranges from .01 inches per sec up to 10 inches per second.
The last diagonal axis is displacement and ranges from .00001 inch to 1.0 inch.
Using either your motor speed, machine speed or if you know the frequency of the vibration, you can compare that to the scale on the x-axis. You follow that up the scale, which will show you where the desirable, acceptable, fair, rough and bad levels will fall. This will help you determine where to set your alarm levels based on vibration.
To determine the exact standards for your industry check which common vibration standards are appropriate. Some common vibration standards are: ISO, ANSI, VDI, API, CTI, Hydraulic Inst, EPRI, ASTM, and JIS.
Watch our full virtual training on Vibration Essentials here!
Need assistance? Contact Neal Systems and speak with one of our expert engineers to see which severity chart is right for your plant.